The short answer
Start at quality score 80, which looks the same as the original at normal viewing size. PicoDiet finds the smallest file that still meets that SSIMULACRA2 score, and you can compare it with the original before you download.
Why a fixed quality setting doesn't work
"Save as JPEG at quality 75" is the usual advice. But the quality number is an encoder setting, not a measure of how the result looks. We saved five images at JPEG quality 75 and scored them, then let PicoDiet find the setting each one needed for a score of 80:
| Image | Score at JPEG quality 75 | JPEG setting it needed | Result score |
|---|---|---|---|
| Harbour photo, 2048 × 1683 | 74.9 | 86 | 80.1 |
| City at night, iPhone, 1440 × 1920 | 71.1 | 92 | 80.5 |
| Rocky beach, 2048 × 1030 | 74.2 | 89 | 81.2 |
| 3D render, 719 × 540 | 73.6 | 91 | 81.4 |
| Screenshot of this site, 2880 × 1800 | 82.0 | 98 | 91.4 |
Quality 75 was ImageMagick's libjpeg; PicoDiet's numbers are jpegli's quality scale. The same "75" landed anywhere from 71 to 82, and the setting each image needed ranged from 86 to 98. The screenshot's overall score passed at quality 75, but its text had visible halos, and PicoDiet's check for the worst spot (below) rejects that. As a PNG it was six times smaller anyway. A fixed number either wastes bytes on some images or damages others.
What the score means
SSIMULACRA2 compares a compressed image with its original and estimates how close they look, on a scale up to 100. Its authors calibrated it against people's ratings of compressed images. Higher means a closer match; roughly:
| Score | What people see |
|---|---|
| 90+ | Visually lossless: no difference even when flipping between the two at full size |
| 80–90 | Very high quality: no difference side by side at full size |
| 70 | High quality: artifacts are hard to notice without the original next to it |
| 50 | Medium: typical of heavily compressed web images |
| 30 and less | Low: obvious blocks, blur and banding |
PicoDiet's slider goes from 10 to 95. The default, 80, is the point where the result looks the same at normal viewing size while files are usually a fraction of the original.
A second check for the worst spot
An average score can hide one damaged area: a smeared face or a line of blurred text in an otherwise perfect photo. So PicoDiet also checks the image region by region and rejects a result if any area is clearly worse than the rest, even when the overall score passes. This is why some images need a higher setting than their average alone would suggest.
What one photo looks like at 90, 80 and 70
A public-domain 11-megapixel harbour photo from a DSLR (4.97 MB as it came from the camera; source), compressed by PicoDiet to three scores:

| Score | File size | Smaller by |
|---|---|---|
| 91 | 3.03 MB | 39% |
| 81 | 666 KB | 87% |
| 71 | 248 KB | 95% |
Most of the saving happens between 90 and 80: the camera spent megabytes on fine noise in the sky that nobody sees. Below 80 the file shrinks more slowly while the changes start to show.
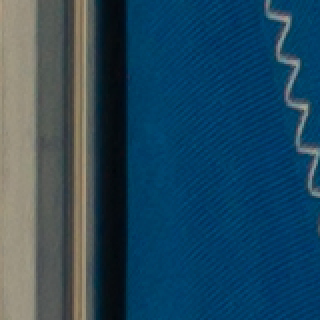 Original
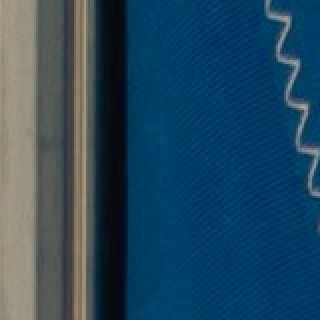 Score 80
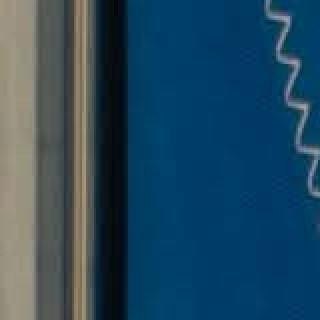 Score 70
See where it changed: the change map
Lossy compression doesn't change an image evenly. PicoDiet scores the result region by region and shows you where it changed most. In the compare view, a small map in the corner marks those regions in yellow to red, numbered markers point at the worst ones, and the view opens zoomed in on the most changed spot. Drag the divider to see the original and the result side by side.
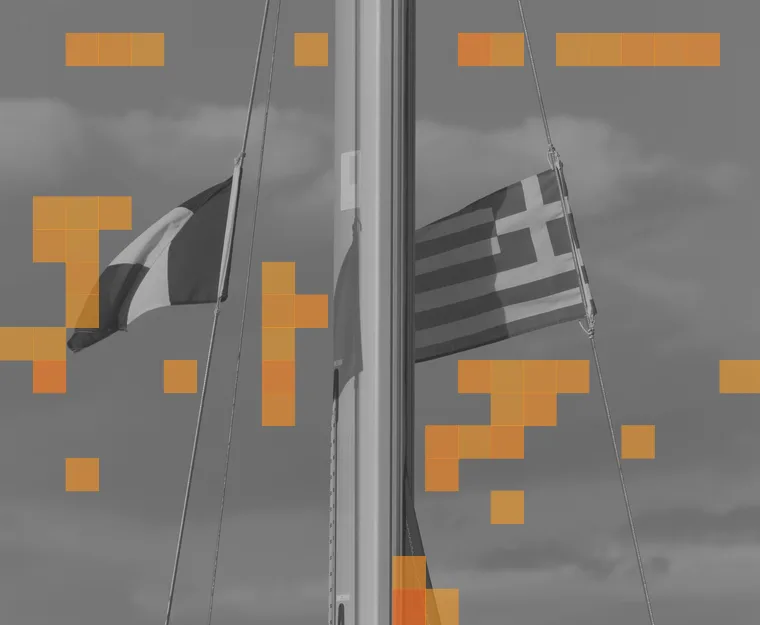
This makes it quick to check what matters to you: a face, a logo, text in a screenshot. If a marked area bothers you, move the quality up for that image only.
How this compares with other tools, measured the same way on 13 public-domain images: the image compressor benchmark.
Lossless or lossy?
Lossless compression keeps every pixel unchanged, so it saves little on photos. Lossy compression changes the image data to save much more, and the question is whether you can see the difference; the harbour photo above lost 87% of its size at score 81. "Without losing quality" in practice means lossy compression that stays above the score where people can tell. PicoDiet picks lossless itself where it wins, for example for some screenshots and animations, and keeps your original whenever it can't make a smaller file that keeps the score.
How to compress an image without visible quality loss
- Drop your images above. PicoDiet compresses each one to score 80 right away.
- For images that will be edited again or inspected up close, move the slider to 90.
- Open an image, look at the marked areas, and download when you are happy.
What happens to your images
Uploaded over HTTPS to the nearest of our servers, processed automatically, and deleted within 3 minutes after you finish. Never shared, sold or used for training. No account needed. Privacy policy
Questions
Can you really compress an image without losing quality?
Without losing any data, only with lossless compression, which saves little on photos. Without losing visible quality, yes: at a SSIMULACRA2 score of 80 or more, people don't see a difference at normal viewing size, and files are often 50–90% smaller.
What is SSIMULACRA2?
An open image quality metric by Jon Sneyers (Cloudinary), designed to predict how people rate compressed images. It is used to tune and compare encoders such as JPEG XL, AVIF and jpegli.
Which quality setting should I use?
80 for websites, email and sharing; 90 for images you will edit again, print or zoom into; 70 for thumbnails and previews where size matters most.
Why does the score of my result differ from the setting?
The quality score you choose is a minimum, so the result usually lands a little above it: 81 or 83 for a target of 80.
Does resizing count as losing quality?
Resizing removes pixels on purpose. PicoDiet only resizes when you choose Auto, a maximum size, or a file size too small for all the pixels, and then it scores the result against the original scaled to the same size.
Are my images private?
Yes. Images are uploaded over an encrypted connection to the nearest of our servers, optimized, and deleted within 3 minutes after you finish. They are never shared, sold or used for training, and there is no account to sign up for. Details are in the privacy policy.